
Why Critical Mineral Strategy Is Now a Negotiation Problem
❮ VSG News
▦ OPINION | Arno Saffran, Thu 25 Dec, 2025When Industrial Policy Meets Deal-Making in the Critical Minerals Economy
Overview
The United States’ reliance on China across critical minerals and battery supply chains has become a defining feature of the contemporary industrial landscape, with implications that extend beyond economics into trade leverage, strategic resilience, and market access.
While China’s dominance across key segments of the value chain is widely acknowledged, the precise contours of US dependence remain poorly understood. Existing trade data captures volume and value, but obscures the firm-level relationships and market concentration that ultimately determine leverage in both commercial and policy negotiations. This gap limits the ability of policymakers—and operators—to distinguish structural dependence from manageable interdependence. This analysis examines the global battery supply chain, highlights where current data falls short, and outlines practical steps to improve visibility into US import reliance.
The Global Battery Supply Chain and China’s Structural Position
China occupies a central position across the global battery value chain, spanning upstream mineral processing, midstream component manufacturing, and downstream battery assembly. However, publicly available data offers an incomplete picture of how this translates into US exposure. Much of China’s production services domestic demand, while a significant share of Chinese firms operate through offshore subsidiaries, further complicating attribution. More granular data is required to support policy and commercial strategies that aim to strengthen US battery supply chains while selectively engaging with, and learning from, China’s industrial model where appropriate.
US dependence also varies materially by segment. Nearly three-quarters of US lithium-ion battery imports originate in China, yet only around 30% of electric-vehicle lithium-ion batteries are imported overall, with the remainder already produced domestically. Exposure is most acute in graphite, where China remains dominant, while reliance on Chinese suppliers for other midstream inputs such as nickel and manganese is considerably more limited. These distinctions matter for both industrial policy design and deal-making strategy.
Why Import Dependence Remains Poorly Understood
Despite the abundance of global trade data, the United States lacks consistent firm-level visibility into supply-chain dependencies. Trade tracking relies primarily on Harmonized Tariff Schedule (HTS) codes, which aggregate imports by commodity, weight, value, and country of origin. Although firm-identifying information is collected at the border, it is not broadly shared beyond the Department of Commerce and US Customs and Border Protection. As a result, three structural challenges persist.
First, classification systems lag technological change. Many battery-related inputs remain grouped under broad, non-specific tariff codes, making it difficult to isolate materials critical to energy storage and electric vehicles. Second, country-level aggregation masks ownership and control. Chinese firms operating manufacturing facilities in third countries often disappear from headline trade statistics, despite maintaining strategic influence over production and pricing. Third, commercial practices such as the use of freight forwarders or confidential import filings—common across the industry—further obscure supplier relationships, limiting transparency for both regulators and market participants.
Supplementary sources, including US Geological Survey reporting and disclosures submitted to the Department of Energy by electric-vehicle manufacturers seeking tax credits, offer partial insight but remain incomplete. These datasets often lack firm-level consistency and may be skewed toward companies whose supply chains already meet policy thresholds. Moreover, mechanisms for sharing such data across agencies—and translating it into actionable commercial intelligence—remain underdeveloped.
Recommendations: Building Visibility Without Constraining Markets
Improving transparency around US exposure to Chinese suppliers does not require disengagement from global markets, but rather more precise instruments for understanding where leverage, dependence, and opportunity truly lie. Four priority actions would materially strengthen the United States’ ability to assess and manage its position across battery and critical mineral supply chains.
1. Modernise Trade Classifications for Battery Supply Chains
Trade classification systems must evolve to reflect the industrial reality of modern battery production. Existing HTS codes are too coarse to distinguish between strategically significant components such as cathodes, anodes, and precursor materials. Refining these classifications would allow policymakers and industry to differentiate between low-risk imports and those that warrant closer scrutiny.
In parallel, distinct classifications should be introduced for recycled battery inputs, including black mass, as well as for emerging chemistries such as sodium-ion and solid-state technologies. Drawing selectively on the more granular import classifications already used in China and the European Union would further improve the United States’ ability to track lithium-ion supply chains without creating new reporting burdens from scratch.
2. Enable Structured Data Sharing Across Government
The United States already collects firm-level trade data at the border, but its strategic value remains underutilised. Expanding controlled access to this information for relevant agencies—including the Department of Energy and the Department of Defense—would materially improve cross-government coordination on supply-chain risk and resilience.
To institutionalise this capability, the Department of Commerce and Customs and Border Protection should be tasked with producing a recurring assessment of vulnerabilities across critical minerals and battery supply chains. Such reporting would support more coherent industrial policy while providing a shared factual basis for engagement with allies and commercial partners.
3. Use Incentives as Intelligence-Gathering Tools
Industrial incentives have proven to be among the most effective mechanisms for generating high-quality supply-chain data. Consumer electric-vehicle tax credits under the Inflation Reduction Act, which require disclosure of mineral sourcing, have already improved visibility into upstream dependencies and should be retained.
Extending foreign entity of concern (FEOC) reporting requirements to commercial vehicle credits and battery manufacturing incentives would further expand the dataset while reinforcing onshoring and friend-shoring objectives. Importantly, these provisions should remain sufficiently flexible to accommodate licensing arrangements and joint ventures—such as technology partnerships—where they accelerate domestic capability without entrenching strategic dependence.
4. Shape Global Standards Through Trade Code Diplomacy
Finally, supply-chain visibility cannot be addressed unilaterally. The United States should take a leadership role in advancing more sophisticated battery and critical mineral classifications through multilateral forums such as the World Customs Organization. Aligning global trade codes would reduce blind spots, improve comparability across jurisdictions, and support coordinated engagement with both producers and processing hubs worldwide.
The Current State of Relations
Over the past decade, relations between the United States and China have become more constrained, shaped by reciprocal trade measures and tighter controls across sectors ranging from semiconductors to critical minerals. Against this backdrop, public discussion of battery and mineral supply chains has increasingly framed the United States as structurally dependent on China for raw materials, intermediate inputs, and finished products. While this narrative reflects genuine concentration in parts of the market, it often overstates exposure without fully distinguishing between global production dominance and actual bilateral reliance.
China’s central role in mineral processing and battery manufacturing is well documented. For inputs such as graphite, cobalt, manganese, nickel, and—more selectively—lithium, China has built unparalleled processing capacity over several decades. In 2022, for example, Chinese firms accounted for virtually all spherical graphite processing and a substantial majority of synthetic graphite output, alongside roughly 70 percent of global battery manufacturing. These figures underscore the scale and integration of China’s industrial ecosystem rather than a direct measure of US vulnerability.
Policy concern in Washington has focused on the strategic implications of this concentration. Batteries and certain minerals serve both civilian and defence applications, and prolonged supply disruptions could affect production timelines across sensitive sectors. There is also unease that market concentration could translate into commercial leverage in periods of heightened political tension. More broadly, as clean energy technologies become a significant driver of economic growth, industrial leadership in these sectors carries long-term fiscal and strategic consequences.
Yet headline statistics obscure important distinctions. A substantial share of China’s production services domestic demand, and global dominance does not automatically translate into unilateral control over US supply chains. Understanding where dependence is concentrated requires clarity on which firms export to the United States, through which channels, and with what degree of market concentration. Firm-level insight matters not only for assessing exposure to geopolitical risk, but also for evaluating market resilience, given that disruptions at a small number of highly concentrated suppliers can have outsized effects.
Successive US administrations have pursued strategies aimed at reducing exposure to concentrated supply chains, including batteries, minerals, and other strategic inputs. While priorities and emphasis have evolved, the underlying objective—greater visibility and resilience—has remained consistent. In attempting to assess the true extent of US reliance on Chinese firms, however, policymakers have encountered persistent limitations in the available data. These gaps raise a more fundamental question: whether existing information systems are sufficiently granular to support informed policy choices and credible engagement with allies and commercial partners.
Improving data quality is therefore not simply a technical exercise, but a prerequisite for nuanced decision-making. Better visibility would enable the United States to strengthen domestic and allied supply chains where necessary, while also identifying areas where continued engagement with China remains economically rational and strategically manageable. This report outlines what is currently known about the global battery supply chain, identifies structural barriers to information, and sets out practical options for improving data collection and dissemination in support of more effective policy and commercial outcomes.
The Global Battery Supply Chain Market
Chinese battery manufacturers such as CATL and BYD occupy a prominent position in global markets, but the more consequential question for policymakers and operators alike is how this global scale translates into influence over specific end markets, including the United States.
Recent analysis from Benchmark Intelligence (2024) illustrates the extent of China’s structural advantage across battery manufacturing. Chinese firms account for approximately 70 percent of global battery pack assembly, with market leadership highly concentrated. CATL alone represents around 35 percent of global output, followed by BYD at roughly 14 percent. Upstream, concentration is even more pronounced. China controls an estimated 91 percent of global anode production, with the five largest Chinese producers collectively holding nearly 60 percent of worldwide market share. While cathode manufacturing appears more diversified by comparison, the market remains China-centred: the top five producers account for just under a quarter of global output, and all but the smallest among them are Chinese firms.
A similar pattern emerges in metals extraction and processing. In cobalt, a single Chinese company—CMOC—accounts for roughly a quarter of global mining output. Manganese production is likewise concentrated, with two Chinese firms, Isky New Materials and Guizhou Dalong Huichen, each controlling more than 20 percent of global supply. Nickel production presents a more geographically dispersed picture, with Indonesia now a leading producer. Yet ownership and control dynamics remain closely linked to China. Major Chinese groups, notably Tsingshan, have established extensive joint ventures and processing arrangements in Indonesia, embedding Chinese firms deep within the nickel value chain. Even where Indonesian companies such as Antam and Harita rank among the world’s top producers, their operations are closely integrated with Chinese partners.
Taken together, these dynamics highlight that market power in the battery supply chain is less about the location of assets than about who controls processing capacity, technology, and commercial relationships. For governments and companies seeking to secure access, understanding these ownership and partnership structures is as important as headline production statistics.
Figure 1: Global Market Leadership in Critical Minerals, Battery Materials, and Cell Manufacturing
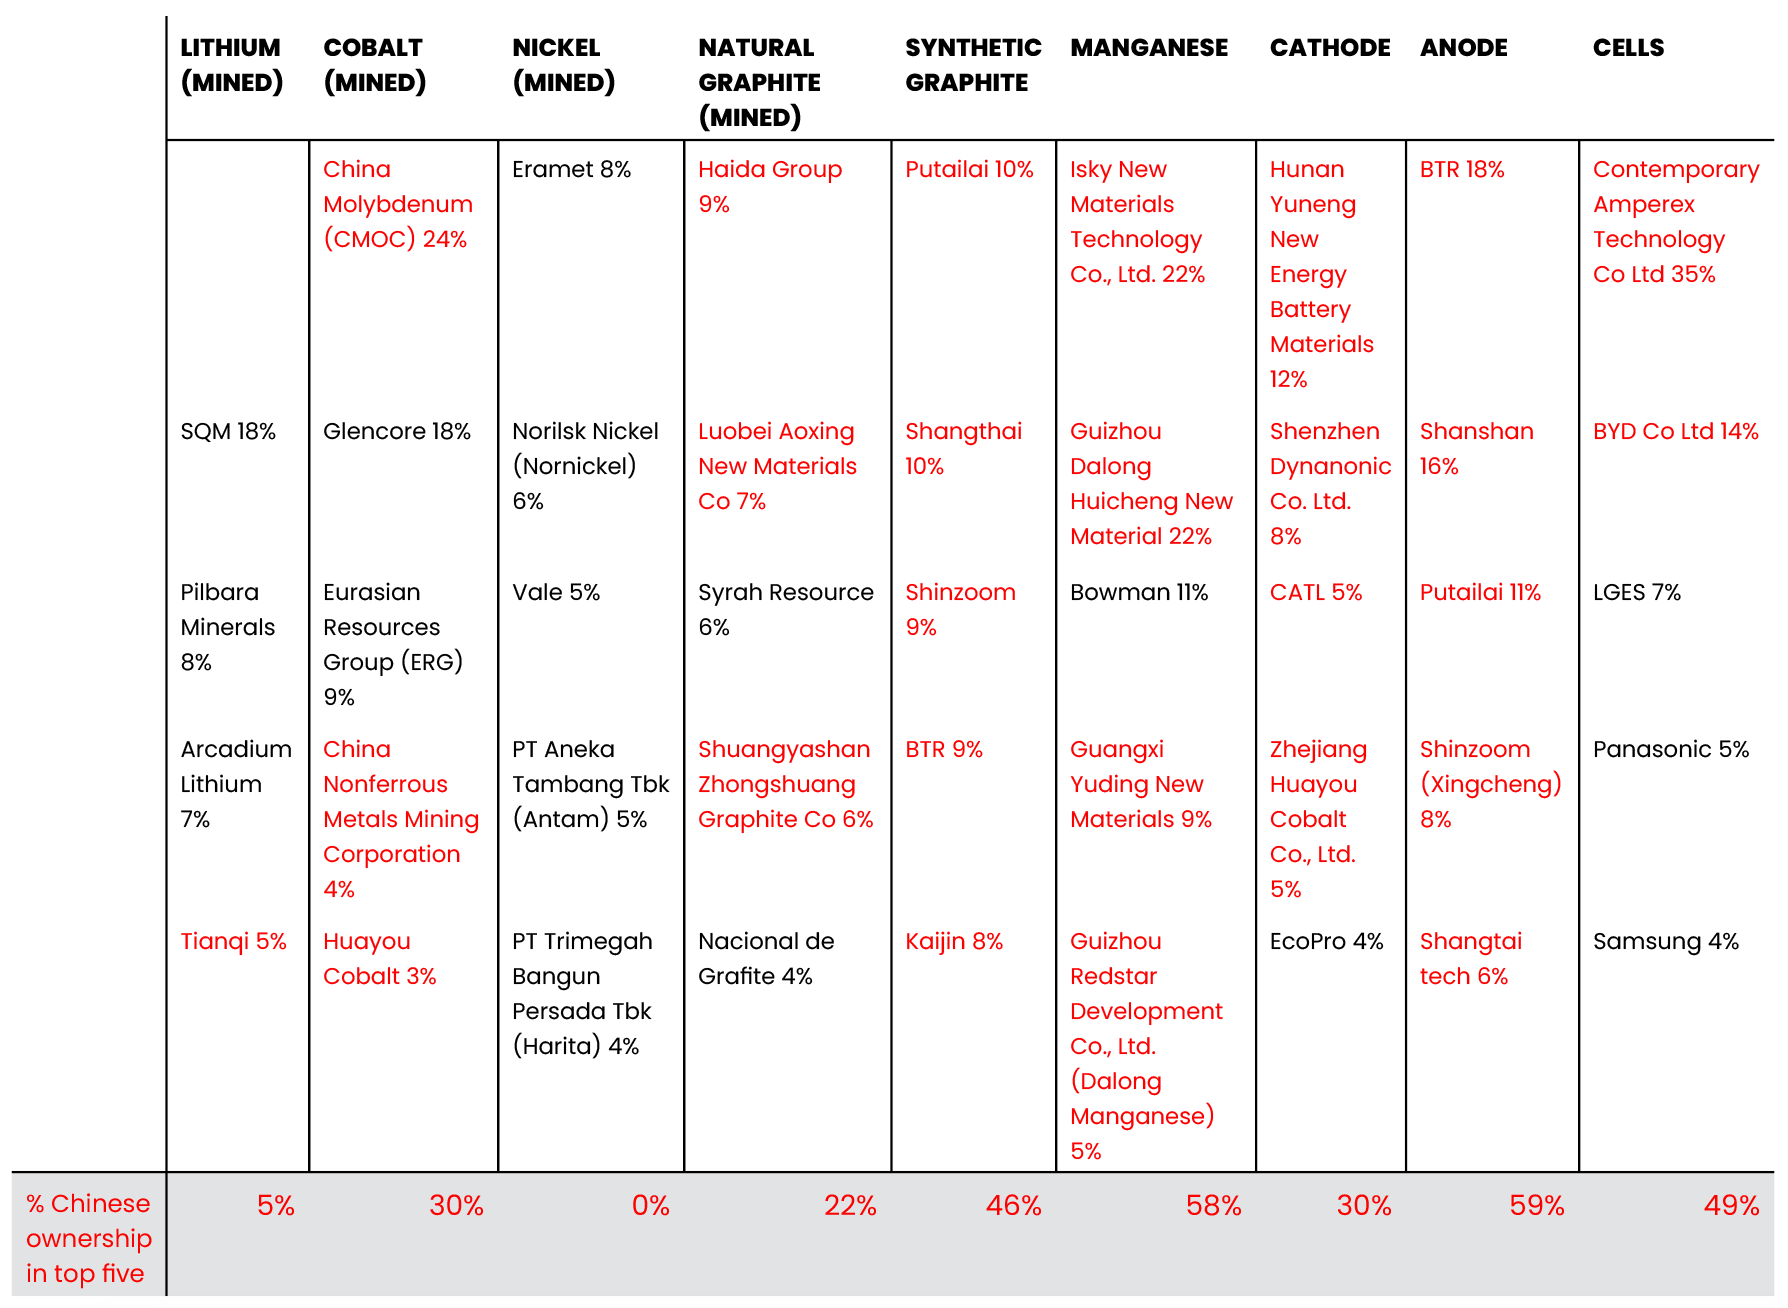
Source: VSG
VSG provides more granular insight into firm-level market share across lithium and graphite (see Figure 2), and a closer examination reinforces the extent of China’s position—particularly in graphite. All ten of the leading producers of spherical graphite are Chinese, collectively accounting for approximately 71 percent of global supply. In flake graphite, seven of the top ten producers are Chinese, together representing roughly 37 percent of worldwide market share.
Lithium production appears more geographically diversified at first glance. Only four of the top ten lithium producers are Chinese, representing around 13 percent of global output. Yet this headline figure understates China’s effective influence. Chinese firms hold significant equity stakes in several non-Chinese producers that rank among the world’s largest. China’s Tianqi Lithium, for example, owns roughly 20 percent of Chilean producer SQM, while Ganfeng Lithium is the second-largest shareholder in Australia’s Pilbara Minerals. Both SQM and Pilbara rank among the top three global lithium producers, underscoring the importance of ownership and control structures that extend beyond country-of-origin labels.
These figures, however, reflect global market positioning rather than direct exposure. They do not answer a more operationally relevant question: which firms are supplying US manufacturers, and through which segments of the battery value chain? Attempting to trace these relationships reveals a deeper challenge. Firm-level supply paths—particularly for midstream components—are difficult to identify with confidence, highlighting the limits of existing data and the complexity facing policymakers and market participants alike.
Figure 2: Control and Market Leadership in Lithium and Graphite Production
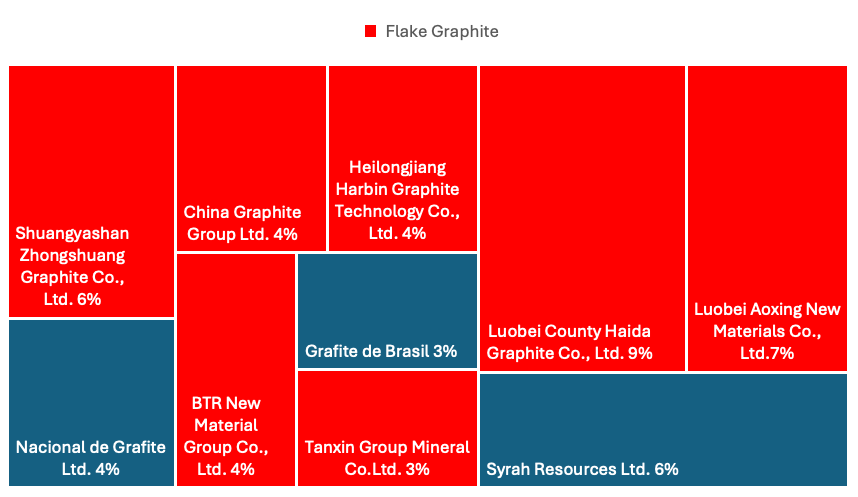
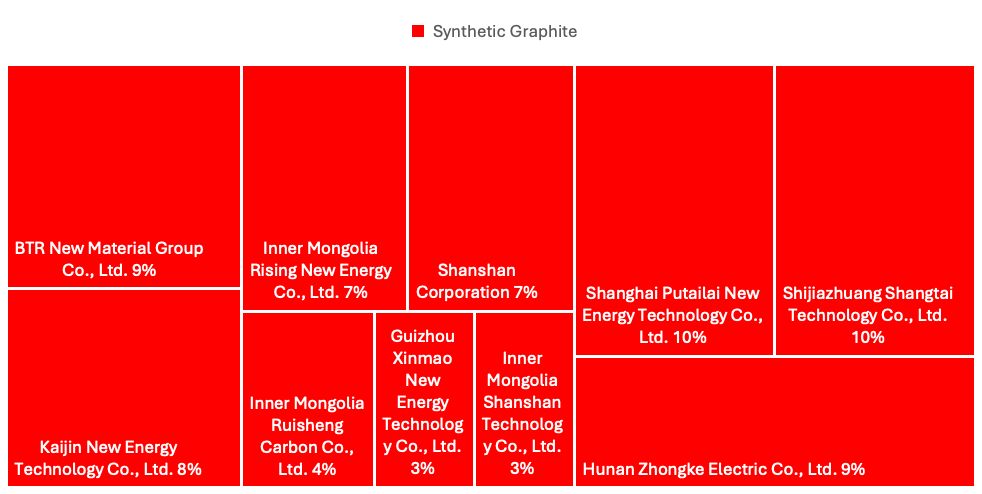
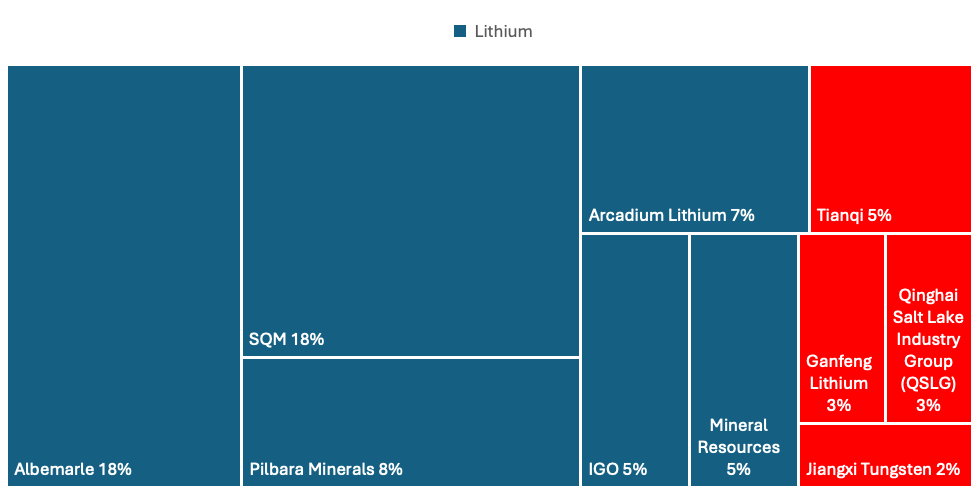
Source: VSG
Chinese Battery Supply Chain Influence in the United States
For US policymakers and industrial operators, knowing not only which countries supply the US battery market—but also how concentrated production is—matters critically. If a single Chinese firm holds a large share of the US supply, any disruption in its operations could ripple across domestic manufacturers in the absence of stockpiles or alternative sources. A recent case illustrates this risk: US drone maker Skydio faced supply interruptions when Chinese firms were temporarily prohibited from exporting batteries.
Tracing these dependencies, however, is far from straightforward. Publicly available data often obscures firm-level relationships, and even policymakers face challenges in assessing which suppliers are critical to US production. Understanding the contours of supply requires insight into both import flows and the underlying ownership structures that shape global market influence.
How US Trade Data Tracks Supply Chains
The primary mechanism for tracking imports is the Harmonized Tariff Schedule (HTS), managed by the US International Trade Commission (USITC) and US Customs and Border Protection (CBP). Each imported good is assigned an 8- or 10-digit HTS code, building on the six-digit Harmonized System (HS) standard maintained by the World Customs Organization (WCO). While HTS codes provide a framework for trade reporting, they are necessarily coarse, reflecting the lowest common denominator among the WCO’s 200 member states and lagging behind technological evolution. For example, until 2022, LED lights and solar panels shared the same code.
HTS codes serve dual purposes: tariff application (mainly at the 8-digit level) and statistical analysis (mainly at the 10-digit level). Academic studies and USITC analyses rely heavily on these data, but the aggregation masks critical details such as firm ownership, cross-border subsidiaries, and the true concentration of market control.
Limitations in Understanding Chinese Influence
Examining HTS-classified commodities under the USITC “Battery Supply Chain” category illustrates both the utility and the shortcomings of this data. Broad classifications—such as “Mixtures of Two or More Inorganic Compounds”—fail to distinguish strategic inputs, while country-level aggregation obscures the fact that major EV battery producers in Poland, for example, are controlled by Chinese firms. Across 65 HTS codes in the battery supply chain, 40 percent of imports are reported as originating in China—a figure that underrepresents Chinese influence given cross-border ownership and global market leverage.
Moreover, the supply picture is dynamic. US lithium-ion battery imports from China grew from 56 percent in 2021 to 73 percent in 2023, though domestic production has also expanded. According to the International Energy Agency, US EV battery production reached 70 GWh in 2023 against demand of 99 GWh, covering more than 70 percent of domestic needs. While imports still represent a meaningful share, this perspective tempers narratives of unilateral dependence.
Market Power Beyond Direct Supply
Chinese dominance in minerals and processed materials also manifests through pricing and overcapacity. By strategically increasing supply, Chinese producers have depressed prices for lithium, cobalt, nickel, graphite, cathodes, and anodes, creating competitive pressure on producers in the US, Canada, and Australia. In many cases, this market influence—shaping costs and incentives across global supply chains—may be as consequential as the specific firms exporting to the US. For companies and policymakers seeking to secure critical minerals, both ownership structures and pricing dynamics must be factored into strategic decisions.
Table 1: Strategic Dependencies in US Battery Material Imports
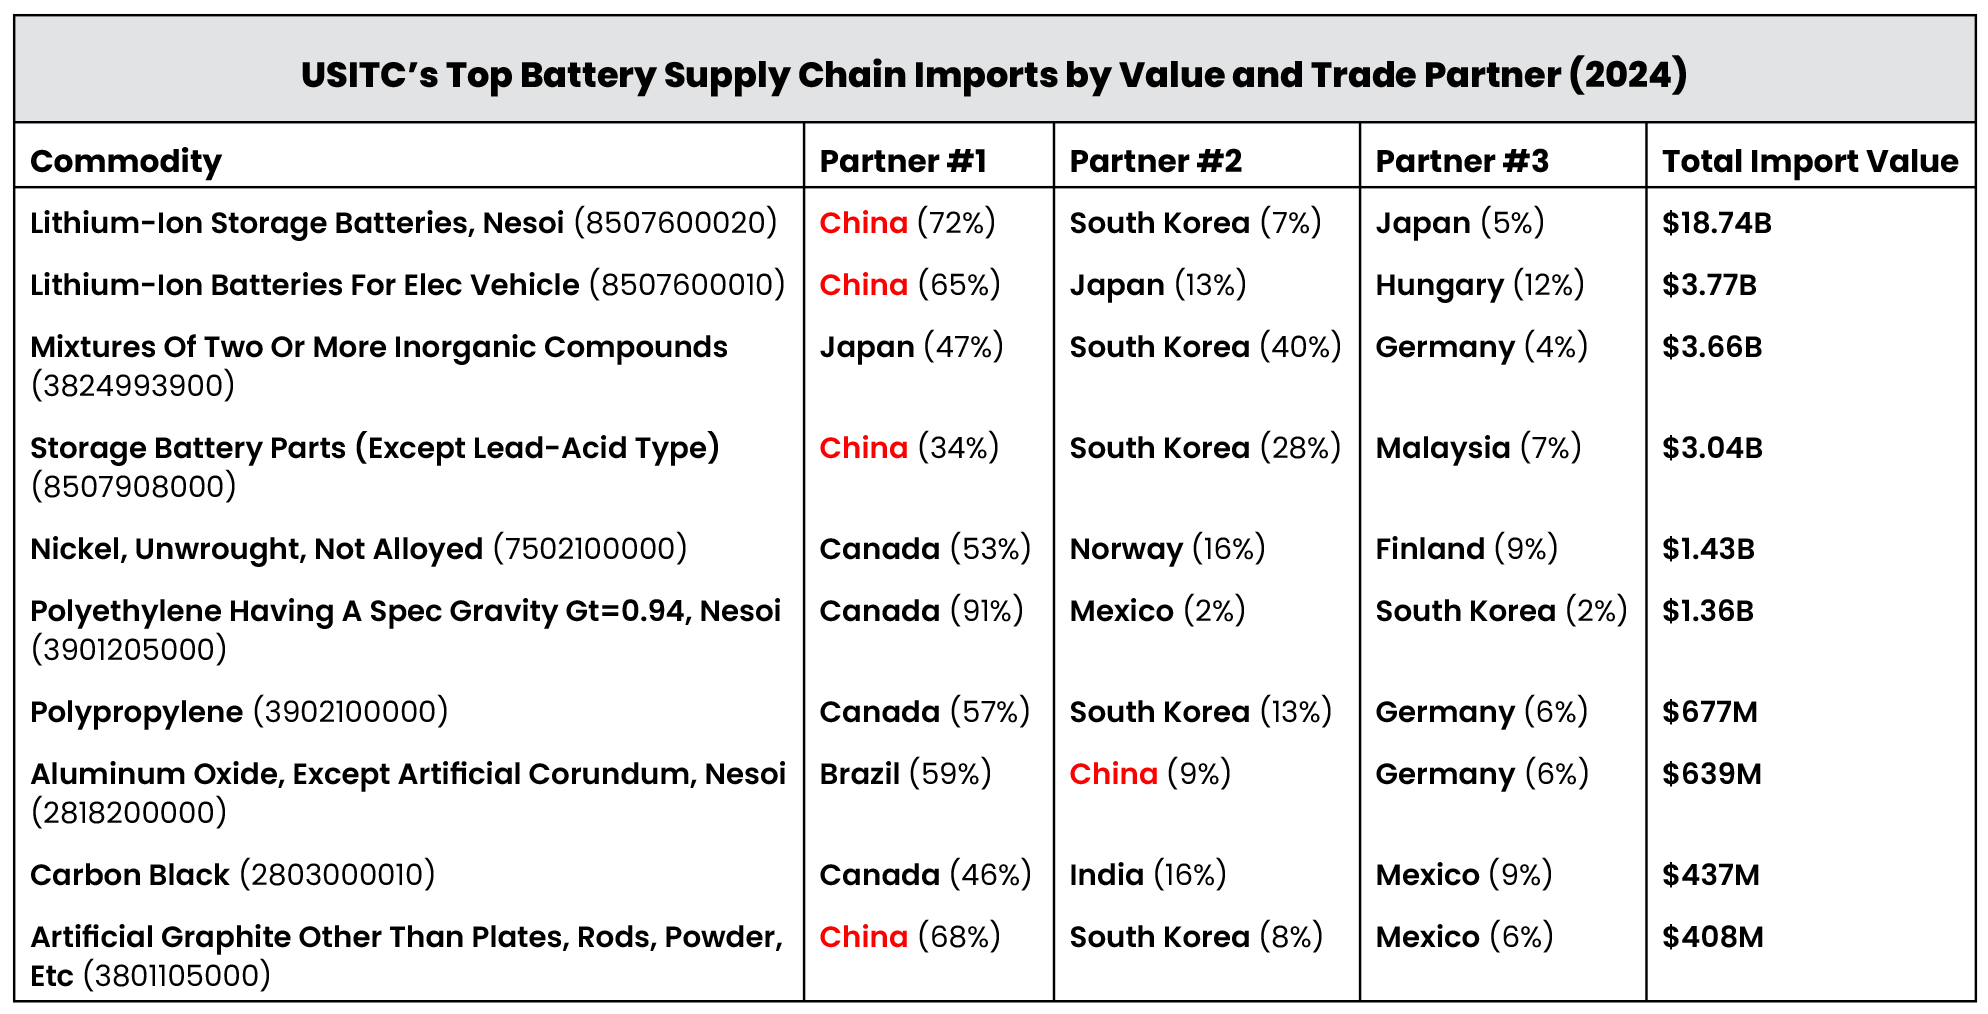
Source: USITC
Limitations of Existing Trade Data Codes
Classifying imports using the Harmonized Tariff Schedule (HTS) system presents three key challenges: outdated classifications, structural limitations in reporting, and the potential for firms to obscure trade flows.
Outdated Codes
HTS and Harmonized System (HS) codes often lag behind rapid technological advances in the battery sector. For example, the third-largest US battery import, “Mixtures of Two or More Inorganic Compounds” (HTS 3824993900), may include a battery electrolyte but also encompasses a wide range of industrial chemicals. Similarly, anodes, cathodes, and precursor materials such as refined graphite are grouped under the same six-digit HS code (850790), obscuring critical distinctions.
These limitations force analysts to make broad assumptions. In a 2023 report projecting 2030 battery supply gaps, RMI assigned all imports under this code to cathode materials, assuming zero for anodes. In reality, graphite—the primary anode material—is largely imported, meaning this assumption exaggerated cathode supply gaps while underestimating anode dependence. RMI acknowledges that “relying on import data as it exists yields significant uncertainty” and notes that current figures should be treated as an upper bound.
Inadequate Specificity
HTS 8- and 10-digit codes offer limited granularity for battery materials. The Department of Energy’s Office of Manufacturing and Energy Supply Chains (MESC) has petitioned the interagency “484(f) committee” to introduce more precise classifications. Starting in 2025, battery-grade graphite will receive a distinct 10-digit code, allowing analysts to separate it from other natural graphite used in electronics. While these updates are important, further refinement is needed.
Ironically, one barrier to greater specificity is confidentiality. Codes cannot distinguish commodities dominated by a single producer, as doing so could reveal proprietary import volumes. For instance, lithium tetrafluoroborate—a key component in lithium iron phosphate (LFP) batteries—lacks a dedicated code, as do many precursor materials for LFP cathodes, likely because a single importer controls most of the supply. This limitation underscores a fundamental tension: the need for accurate supply chain data versus the protection of sensitive commercial information.
Structural Limitations and Data Obfuscation in US Import Tracking
The way the United States collects trade data creates structural challenges for policymakers and analysts attempting to map supply chain dependencies. Imported goods are recorded by the importer on a Bill of Lading, verified by US Customs and Border Protection (CBP) in the Automated Commercial Environment (ACE), and later aggregated by the US Census Bureau. Before public release, firm-identifying information is removed, leaving only HTS 8- and 10-digit codes and country of origin.
Because 8-digit codes determine tariff rates, importers have limited incentive to provide accurate 10-digit classifications. Similarly, CBP—tasked with processing millions of monthly shipments—has little motivation or bandwidth to correct 10-digit records when the tariff assessment is unaffected. The result is a structural blind spot in tracking precise imports of critical battery and mineral components.
Deliberate Obfuscation by Firms
Beyond structural shortcomings, firms can intentionally obscure their trade data. Common tactics include using freight forwarders—such as FedEx or Kuehne+Nagel—to mask the original shipper in manifests. Companies can also request “Confidential Treatment of Vessel Manifest Data” under 19 C.F.R. § 103.31, concealing the names and addresses of both importers and shippers.
Since the Census Bureau removes identifying information before publication, firms can effectively hide their participation in US imports from public view. This practice, while legal and widely used for competitive advantage, severely limits transparency. Even battery manufacturers may be unaware of the origin of key upstream components.
Implications for Policy and Strategic Planning
Currently, only CBP and the Department of Commerce retain access to firm-level ACE data that links critical mineral imports to specific companies. Whether robust mechanisms exist to track these materials as they move through multiple firms in the battery supply chain remains unclear. Consequently, independently verifying mineral sourcing is extremely difficult for government agencies and impossible for the public.
The practical outcome is that analysts can only produce an incomplete portrait of exporters to the US. HTS codes are unreliable for determining market share, and visibility is limited to firms that do not use confidentiality filings or freight forwarders. While this data provides some insight into who participates in US imports, it falls short of enabling accurate risk assessment or strategic supply chain planning.
Challenges in Using Alternative Data Sources
Beyond trade data, policymakers can draw on other sources to assess US import dependence in minerals and batteries, notably the US Geological Survey (USGS) and the Department of Energy’s electric vehicle (EV) supply chain data.
USGS Mineral Data
The USGS collects mineral import data through voluntary manufacturer surveys, producing annual Mineral Commodity Summaries and the more detailed Minerals Yearbook. While these publications provide insights into supply and demand patterns, they are often published one or more years after the fact and anonymize firm-level data, showing only country-level dependencies.
This approach obscures critical nuances. Many minerals tracked by USGS have applications beyond EVs and batteries, and the data does not capture their use in cathodes, anodes, or finished batteries. As a result, visibility into the full supply chain remains limited. For example, while US reliance on China for graphite is clear, USGS data cannot fully indicate which firms or subcomponents depend on these imports, constraining policymakers’ ability to identify vulnerabilities or design targeted mitigation strategies.
Table 2: US Critical Mineral Supply: Country of Origin and Chinese Influence
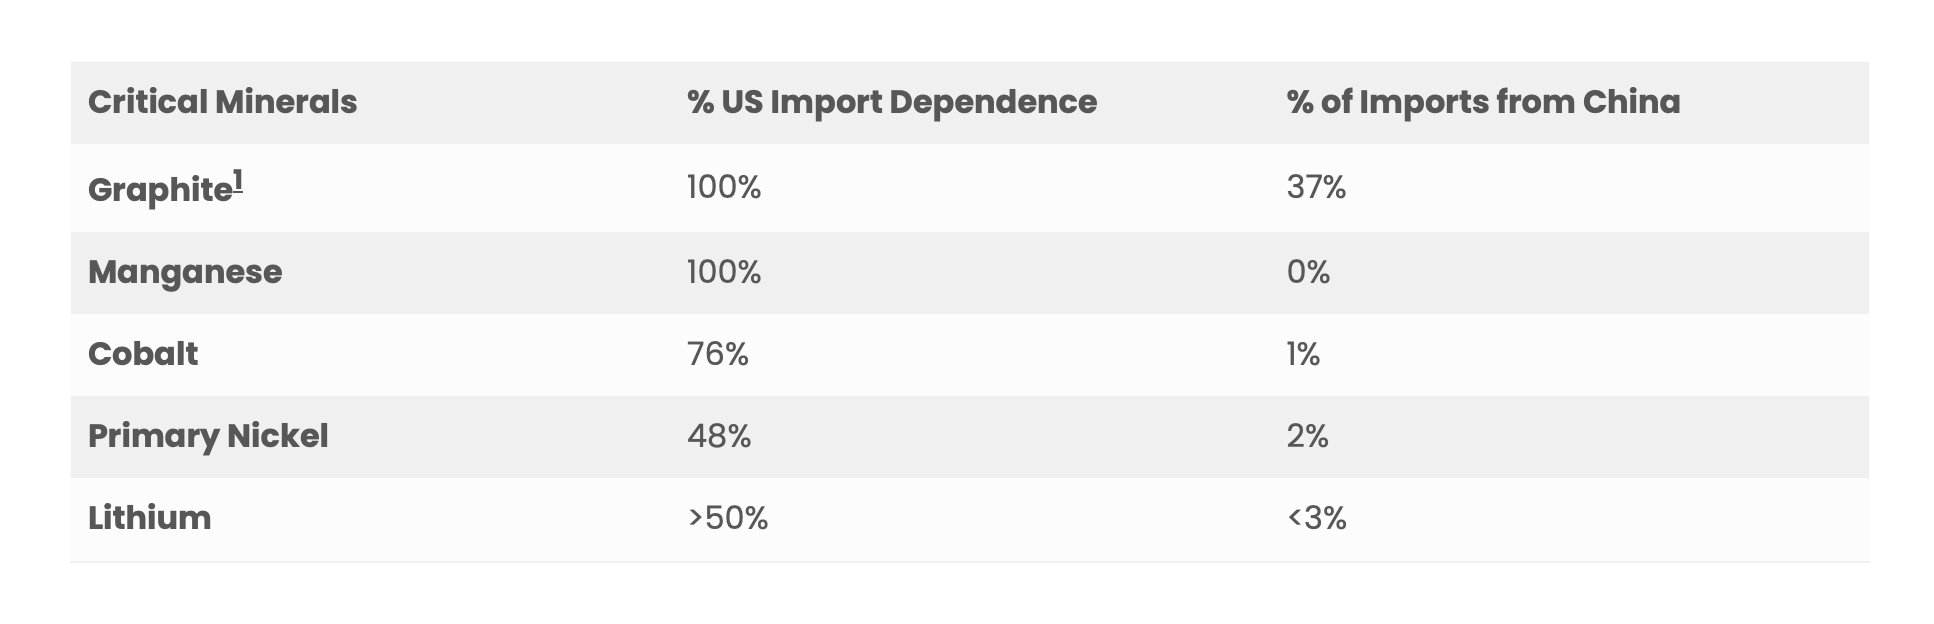
Source: USGS
Department of Energy Data from EV Manufacturers
Under the previous administration, the U.S. government sought greater visibility into EV battery supply chains through Section 30D of the Inflation Reduction Act (IRA). Manufacturers applying for consumer tax credits were required to document the origin of the critical minerals in their batteries and the location of battery assembly. To qualify for the full $7,500 credit, companies had to:
Source at least 40% of critical minerals from the U.S. or free-trade agreement (FTA) countries, increasing annually to 80% by 2026.
Assemble at least 50% of battery components in North America, rising to 100% by 2028.
Applications also needed to demonstrate limited influence from “foreign entities of concern” (FEOCs), covering China, Russia, North Korea, and Iran. FEOCs include state-owned companies or firms with government-affiliated leadership. Private Chinese companies like CATL or Gotion were generally not classified as FEOCs, though exceptions occasionally arose.
FEOC rules produced unexpected challenges. Graphite, critical to batteries and largely sourced from China, was initially exempt until 2026 due to traceability issues. However, in January 2025, the Chinese company BTR and its subsidiaries were designated as FEOCs, disrupting U.S. manufacturers’ plans to source graphite from Indonesia and Morocco.
While FEOC requirements apply only to consumer EV tax credits, other incentives such as the 45X Advanced Manufacturing Production Credit and 45W clean vehicle leasing credit currently have no FEOC restrictions. The DOE’s reporting requirements for tax credit eligibility are detailed, including the weight of applicable critical minerals per battery cell and the traceability of components from factory to vehicle.
These submissions provide rare, firm-level insights into U.S. dependence on Chinese supply chains. In the first year, only 27 vehicles from nine automakers qualified for the full credit, suggesting high reliance on foreign minerals. By the second year, eligibility expanded to 42 vehicles, reflecting private-sector diversification efforts.
Ongoing policy uncertainty under the Trump administration, which may eliminate consumer tax credits, threatens these efforts. Removing them would slow the on-shoring and ally-shoring of critical mineral supply chains and eliminate a key mechanism for collecting granular data on battery sourcing.
Potential Measures to Improve U.S. Understanding of Supply Chain Dependence
1. Modernize Trade Codes for Battery Supply Chains
The most immediate step is updating HTS codes to reflect today’s battery import landscape. Public petitions to the 484(f) Committee—the interagency Committee for the Statistical Annotation of Tariff Schedules, composed of representatives from USITC, CBP, and the Census Bureau—can initiate this process. The committee reviews submissions biannually.
Priorities should include creating distinct codes for cathodes and anodes, a dedicated category for lithium iron phosphate (LFP) cathodes, and a classification for recycled battery “black mass.” Emerging technologies, such as sodium-ion and solid-state batteries, should also be evaluated for separate codes. A consultative approach with EV and battery manufacturers will help ensure that categorizations reflect real-world supply chains and operational priorities. The U.S. can also draw lessons from China and the EU, which maintain more detailed datasets for tracking lithium-ion supply chains.
2. Strengthen Data Sharing Across Government Agencies
The U.S. government could enhance its visibility of supply chain dependencies by improving access to firm-level data stored in ACE, the Department of Commerce and CBP database. While commercial sensitivities must be protected, select policymakers—particularly within the DOE’s Office of Manufacturing and Energy Supply and supply chain specialists at the Department of Defense—could benefit from access to this information.
Alternatively, the Departments of Commerce and CBP could produce an annual, interagency-vetted supply chain vulnerability report for the Federal Consortium for Advanced Batteries (FCAB), offering a comprehensive view of risks across critical minerals and battery components. Proposed legislation, such as Sen. John Cornyn’s bill directing the Secretaries of Energy and Interior to report on global critical mineral resources, represents a step forward. However, a holistic view—covering resource extraction through final battery assembly—is needed.
A complementary option would be for the U.S. Geological Survey to publish more detailed, public-facing assessments of mineral supply chains, including embedded minerals in cathodes, anodes, and finished batteries. Where sensitivity dictates, classified assessments could be prepared in parallel, potentially in collaboration with the U.S. intelligence community.
Retain and Expand Incentives and Strengthen Supply Chain Visibility
3. Preserve EV Incentives and Expand Reporting Requirements
The United States should maintain consumer electric vehicle incentives and the associated reporting requirements for eligibility, while extending FEOC (Foreign Entity of Concern) provisions to include the 45X manufacturing production credit and the 45W EV leasing credit. Doing so would simultaneously reinforce on-shoring and ally-shoring of production and enhance the government’s ability to map supply chains at the producer level.
Applying FEOC rules to 45X and 45W must be carefully balanced against the need to foster learning from global technology leaders—many of whom are Chinese. Rules should accommodate licensing and joint ventures, such as the Ford–CATL partnership for lithium iron phosphate batteries, ensuring that knowledge transfer and domestic capacity development are not inadvertently blocked. Some proposed legislation, like the No Gotion Act (S.R. 369), imposes overly restrictive ownership thresholds that could inhibit joint ventures and co-investment agreements, constraining access to advanced battery technologies.
If consumer 30D tax credits are eliminated and no FEOC requirements are applied to 45X or 45W, reporting obligations on mineral sourcing and battery content would disappear entirely, removing critical visibility into domestic and allied supply chains.
4. Lead International Standard Setting
The United States should also work with international partners to harmonize battery supply chain reporting standards via the Harmonized System (HS). Many countries are increasingly focused on traceability to uphold labor and environmental standards. Aligning U.S. HTS codes with international norms would facilitate consistent reporting and reduce compliance burdens for private-sector actors operating across multiple jurisdictions. By February 2027, the European Union will require battery passports to trace EV and battery materials. Establishing harmonized standards globally should be a priority, improving transparency while supporting sustainable and resilient supply chains.
Concluding Thoughts
Diversifying supply chains through domestic production and ally-shoring remains an important strategic goal. Yet the mere fact that a supplier is Chinese does not automatically justify exclusion from the U.S. market. In certain cases, such as battery-grade graphite, alternatives are limited, and efforts to source elsewhere can introduce new forms of risk. For example, a U.S.-supported Syrah Resources graphite mine in Mozambique was temporarily shuttered following election-related unrest in a region with active Islamist movements, illustrating how political risk can simply shift geographically.
Chinese firms such as CATL are dominant not only in scale but also in technological expertise, particularly in emerging battery chemistries like lithium iron phosphate (LFP), which is increasingly displacing nickel-manganese-cobalt (NMC) as the industry standard. Regulatory actions, including the Department of Defense’s 2025 blacklist of CATL—citing its alleged ties to China’s military—restricts its eligibility for DOD contracts but may also carry broader reputational implications. CATL continues to supply Tesla and partners with Ford to manufacture LFP batteries in Michigan. Congressional efforts, such as proposed bans or accusations of forced labor against CATL and Gotion, illustrate the political appetite in Washington to exclude Chinese firms, even where evidence remains difficult to verify.
Yet these types of licensing and joint venture arrangements may be essential for the United States to catch up technologically with China in advanced battery manufacturing. Excluding such collaborations outright risks leaving the U.S. further behind in critical innovation areas.
This underscores the need for a nuanced, information-driven approach. Rather than focusing solely on identifying vulnerabilities and decoupling from Chinese suppliers, U.S. policymakers would benefit from a sophisticated strategy that maps supply chain dependencies, monitors firm-level dynamics, and leverages collaboration where strategically advantageous. Without better data and transparency, efforts to secure U.S. supply chains may remain partial and reactive rather than comprehensive and proactive.
References:
National Security Risk of Chinese Mineral Dependence
Highlights the strategic vulnerability of US reliance on China for critical minerals and batteries. US dependence exposes potential risks to military supply chains, economic sectors, and cybersecurity.
Link: https://warontherocks.comDomestic Lithium-Ion Battery Production
Shows US battery production capacity relative to imports. Around 70% of US EV battery demand is produced domestically; imports (mostly from China) cover 30%.
Link: https://www.iea.orgHarmonised Tariff Schedule (HTS) Codes
Explains limitations in US trade data tracking. HTS codes aggregate imports by commodity and country but lack firm-level granularity.
Link: https://www.usitc.govChinese Firms in European Battery Manufacturing
Illustrates Chinese corporate influence beyond direct exports. Chinese-owned factories in Poland distort country-level import data for batteries.
Link: https://mobilityportal.euDOE Tax Credit Data
Source of firm-level insights on US battery supply chains. EV manufacturers submitting for tax credits must disclose mineral sourcing, revealing dependencies on China.
Link: https://www.energy.govDetailed Import Codes for Batteries
Suggests international best practices for tracking lithium-ion supply chains. Chinese and EU import codes provide more granular tracking than current US codes.
Link: https://www.sciencebase.gov45W EV Leasing Tax Credit
Part of recommendations to extend FEOC rules for industrial incentives.Expanding reporting requirements to commercial EV credits would improve visibility into mineral sourcing.
Link: https://pluginamerica.orgFEOC Licensing Guidance
Provides details for joint ventures with Chinese firms under US rules. Ensures firms like Ford and CATL can collaborate while promoting domestic and allied sourcing.
Link: https://www.energy.govFEOC Licensing and Compliance Considerations
Further explanation of regulatory compliance for critical mineral sourcing. Balances technology learning from Chinese firms with security concerns.
Link: https://carnegieendowment.org
How relevant and useful is this article for you?
★ 7
ABOUT THE AUTHOR(S)
— Arno Saffran
Arno developed his approach through roles in client development (KPMG) and strategic commercial engagement (affiliated with advisories including Hakluyt), focusing on complex industrial and energy sectors.
VSG works across the extractive value chain, positioning people who form the critical bridge to early-stage relationships and commercial access in complex markets.